[et_pb_section fb_built=”1″ admin_label=”section” _builder_version=”3.22″][et_pb_row admin_label=”row” _builder_version=”3.25″ background_size=”initial” background_position=”top_left” background_repeat=”repeat”][et_pb_column type=”4_4″ _builder_version=”3.25″ custom_padding=”|||” custom_padding__hover=”|||”][et_pb_text admin_label=”Text” _builder_version=”4.4.6″]
Virtually all computing systems rely in one-way or another on general-purpose hardware and software components. By design, general-purpose components cater to many families of applications. For instance, a web server engine such as NGINX can be used to serve mostly static data in a documentation website, or be used as a proxy to a dynamic e-commerce website. These are very different use-cases of the same software system. It is for this reason that many of the general-purpose systems, such as the NGINX web server in this example, allow users to apply configurations that are tailored to their applications.
Configuration tuning is the process of tailoring settings to the needs of a specific application. This can be performed statically, before the application runs in production, or dynamically, while the application runs. Static optimization, therefore, is the process of finding one configuration of settings that tailors the system for a specific application.
While static optimization is as old as computing itself, most performance engineers that are tasked with this challenge do so manually, for a variety of reasons. But how can static tuning be automated? Let’s break down the manual process of static tuning and see which parts can be automated.
How would a performance engineer go about manually optimizing a system?
The first step in manually optimizing a system is to have a benchmark that needs to be optimized. For example, we might have a website that we are interested in maximizing the number of requests per second that it can support. In this case, our environment is the setup of the web server, with its infrastructure, supporting database, etc., and the benchmark is a program that applies load on the web server and measures its performance metrics. Setting up an environment for the purpose of performance tuning is not a trivial task, see our previous blog for tips on how to do this effectively.
The second step is to choose the optimization goal. In our website example, we can optimize for the maximum number of web requests per second, or we can optimize something else like the 90th percentile of the latency its users exhibit.
The third step involves defining which configuration settings we want to optimize. If we run in a containerized environment such as Kubernetes, it makes sense to optimize the allocated CPU and memory slices per container, as these can have a big effect on both performance and cost. We might also want to optimize OS settings, hardware settings, and so on.
But how do we find out which configurations to focus on? In our example, should we focus on sysctls of the Linux OS? Which ones? What about the configuration files of NGINX? Performance engineers usually rely on their past experiences to know which settings to focus on when tuning. There are also countless blogs explaining about different system tunables that can help in improving performance. More on this later.
Now that we know the optimization goal, how to measure the effectiveness of a particular configuration, and which settings we can tune, we can proceed to the iterative process of configure-run-measure-repeat. In this process, we first configure the system to a configuration that we believe will provide better performance for our benchmark. In the next step, we run our benchmark and observe the results. When dealing with real systems, it is important to remember that our measurements can be “noisy” due to variability in those systems. This means that in certain systems, we would need to sample the system (i.e. run the benchmark) numerous times to gain high confidence in the measurement results.
We continue to iterate through this loop either until we achieve a satisfactory speedup, or when we conclude that no more efforts should be spent on further tuning. At that point, we’ll usually gather all the measurement results and plot them in a graph, so we can learn about what worked and what didn’t. In some cases, we might be able to generate insights from the graphical representation that can help in further tuning.
The challenges of manual system tuning
Clearly, the process of manual tuning presents numerous challenges, and anyone dealing with performance tuning has stumbled upon many of the questions below:
- Which tunables should we explore? Where can we get up-to-date information about them? Is the best-practices blog we’re reading reliable?
- How many tunables should we explore? Too many will take to much time, but if we explore only a few we might miss an opportunity.
- How can we avoid errors in configuring the system? Iterative processes are error-prone.
- We tried x configurations, which configuration shall we try next in iteration x+1?
- How many times should we measure a configuration until we can be confident with its performance?
- Our system changed (hardware, software, compiler, runtime, etc.) – is it worth our time retuning our system?
- Are the results we achieved reproducible?
- Are we looking at the right target metric?
These are just some of the challenges performance engineers face when manually tuning systems. Can we solve some of these challenges in a scientific way?
Automating the static performance optimization process
The good news is that the long iterative process of configuring, running and measuring can be completely automated: Optimizer Studio, Concertio’s static optimization tool, can be used to do this.
Choosing what to test next. Concertio uses a genetic algorithm to perform the configuration search, and it converges quickly to the optimal configuration.
Handling variability. Optimizer Studio makes sure to handle the variability inherent to real systems, by detecting the noise properties of the system under test, repeating experiments as needed, and providing support for point estimators (more on that in this blog).
Defining the tunable settings. Optimizer Studio comes with an extensive library of thousands of tunables to choose from, including tunables in CPUs, operating systems, Kubernetes, configuration files of databases and web servers, compiler flags and others. See this link for the list of supported embedded knobs. Users can also add their own user-defined tunables to the mix by providing supporting set and get scripts, so that virtually any system can be optimized using Optimizer Studio.
Defining the goal of optimization. The optimization goal can be based on a single metric, for instance, maximizing the requests per second, or minimizing the average latency. In many realistic scenarios, however, performance engineers need to optimize numerous targets. Optimizer Studio supports defining multi-objective targets, for instance, maximizing the number of requests while the 90th percentile latency doesn’t exceed 50 milliseconds. Another example is optimizing for the best performance under a cost constraint.
Comparing manual Vs. automatic static tuning
Compared with manual tuning, automatic tuning achieves greater speed-ups and at lower efforts, because the optimization algorithm can approach the global maximum by searching smarter and faster. The bonus is that an automated process is less error prone than a manual process, so the optimization tasks can finish sooner. Let’s break it down:
Automated performance tuning attains greater speedups. Black box optimization algorithms deal with very large parameter spaces better than humans. These algorithms, and especially genetic algorithms that are used by Optimizer Studio, can find better configurations with fewer iterations than manual tuning.
Performance tuning with Optimizer Studio is much shorter than manual tuning. This is due to two reasons. The first is that the optimization algorithm used by Optimizer Studio can quickly settle in on a well-performing configuration, with fewer iterations than manual tuning. The second reason is that automated performance tuning can take place overnight and on weekends, without requiring any human intervention.
Automated performance tuning is more cost-effective than manual tuning. To name a few, these are some time-consuming tasks performance engineers spend their time on when tuning configurations:
- Researching tunables and staying up-to-date
- Configuring systems and running the benchmark in each iteration
- Correcting errors of misconfiguration
- Repeating experiments that were already performed in the past when something in the system changed, such as a major release of one of the underlying components, or a hardware change.
- Reporting the results graphically to the team and the managers
All of the above time-consuming tasks are completely automated by Optimizer Studio:
Library of tunables. The extensive library of tunables that comes with Optimizer Studio saves engineers a significant amount of time and effort in setting up their experiments. In addition, each new software version such as a new OS kernel might introduce new tunables. Having a library saves the time of constantly following up on such changes and testing each addition.
Fewer errors. Human misconfiguration errors are all but eliminated using the automated process. Configurations and their respective performance metrics are never misplaced.
Reproducing experiments. Another major advantage to automation is the ability to reproduce past experiments. This is important for numerous reasons. The first is that if something changes in the underlying components of the system, it might warrant another attempt at tuning. Having the ability to reproduce past experiments removes the hassle of setting everything up again. Another reason is that engineers might move to other positions, taking their knowledge of the experiments with them. With automation, however, this knowledge is retained, and anyone can reproduce those experiments.
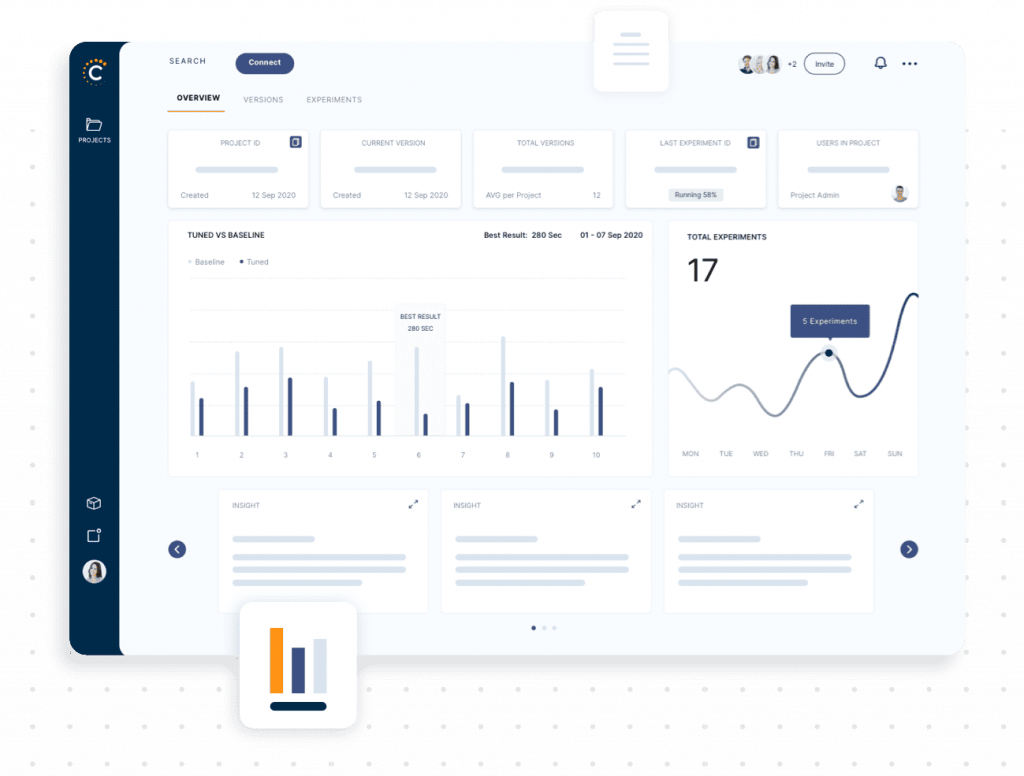
Experiment management system. Having an experiment management system simplifies the process of generating insights from performance tuning experiments. Not only does it ease the process of reporting, but it also enables engineers to browse through previous experiments and examine those results.
How performance engineers leverage automatic static tuning
Effective performance tuning requires deep understanding of the underlying systems, as well as persistence in iterating the mundane performance tests. All the features of Optimizer Studio that were described above, help in achieving grater speedups while reducing the time spent by engineers on configuration tuning. This frees up precious time for performance engineers that can be invested in higher-level tasks, such as setting up experiments, performing root-cause analysis or even re-architecting the systems when needed.
[/et_pb_text][/et_pb_column][/et_pb_row][/et_pb_section]


