

Go has become increasingly popular in recent years, as it has successfully combined the simplicity and productivity of Python and the power of C. It features an embedded garbage collector, as well as CSP-based message-passing concurrency via Gorutines and Channels. Achieving maximum performance of a Go program usually requires tailoring the garbage collector and the concurrency level to the runtime requirements of the program. Fortunately, it is possible to do so without any code change.
Go programs receive several parameters through the environment, two of which are of interest from a tuning perspective: GOGC and GOMAXPROCS. The Golang documentation describes them:
- The GOGC variable sets the initial garbage collection target percentage. A collection is triggered when the ratio of freshly allocated data to live data remaining after the previous collection reaches this percentage. The default is GOGC=100. Setting GOGC=off disables the garbage collector entirely.
- The GOMAXPROCS variable limits the number of operating system threads that can execute user-level Go code simultaneously. There is no limit to the number of threads that can be blocked in system calls on behalf of Go code; those do not count against the GOMAXPROCS limit.
By default, go programs run with GOMAXPROCS set to the number of cores available. The documentation also states that GOMAXPROCS “will go away when the scheduler improves.” Until that happens, GOMAXPROCS should be tuned for best performance.
Tuning GOGC and GOMAXPROCS
Garbage collection refers to the process of managing heap memory allocation: free the memory allocations that are no longer in use and keep the memory allocations that are being used. Garbage collection significantly affects the performance of the benchmark as highlighted in this excellent blog post.
Selecting the right number of Gorutines and the threshold to trigger the garbage collector is not trivial. For instance, when running the crypto/ecdsa benchmarks, all of the allocated data during a run is immediately discarded at the end of each cycle and the garbage collector is then triggered. This means that freshly allocated data increases linearly with the number of goroutines (threads), while the live data remaining from the previous run is fixed. This leads to triggering garbage collection more frequently, which results in wasting much more time on garbage collection (see this blog for a more elaborate explanation). As a result, the optimal number of Gorutines is dependent on GOGC.
Attempting to find the optimal GOMAXPROCS and GOGC values using brute force is time consuming, even for two tunables. A better alternative is using Optimizer Studio, which could find the optimal settings of these variables within a very short period of time (in our case, less than 5 minutes).
Using Optimizer Studio to optimize Go applications
As an example, we will optimize the BenchmarkSignP256 benchmark from the crypto/ecdsa package, which is part of the official Golang source code. We will attempt to minimize the time required for each elliptic curve signature operation. We begin with wrapping the benchmark in a script that runs it and extracts the time per operation and the number of iterations metrics:
#!/usr/bin/env bash

## Run the benchmark
result=$(go test crypto/ecdsa -run=Bench -benchmem -bench=BenchmarkSignP256)

if [[ $? -ne 0 ]]; then
        echo "Failed to run the benchmark test"
        echo "invalid" > /tmp/ns_per_op
        exit 1
fi

ns_per_op=$(echo $result | awk '{print $9}')
[[ $? -ne 0 ]] || [[ -z "$ns_per_op" ]] && echo "invalid" > /tmp/ns_per_op || echo "$ns_per_op" > /tmp/ns_per_op

iterations=$(echo $result | awk '{print $8}')
[[ $? -ne 0 ]] || [[ -z "$iterations" ]] && echo "invalid" > /tmp/iterations || echo "$iterations" > /tmp/iterations

exit 0
Next, we craft a configuration file for Optimizer Studio, importing the embedded Go tunables:
import:
  optimizer.go:

domain:
  common:
    metrics:
      Time per operation [ns]:
        kind: file
        path: /tmp/ns_per_op
      Iterations:
        kind: file
        path: /tmp/iterations
    include_metrics: [.*]
    plugins: [libfilemetricplugin.so]
    target: Time per operation [ns]:min
global_settings:
  min_samples_per_config: 4
  min_baseline_samples: 4
  project_guid: c024fa19-3554-4bd0-a3bf-e674fbf8b397
We then run Optimizer Studio, which will iteratively run the benchmark script on a single socket AMD EPYC 7402P 24-Core Processor machine on Packet (c3.medium.x86) with Go version 1.13.4. Rather than using brute force to find the optimal values of GOGC and GOMAXPROCS, Optimizer Studio uses its optimization algorithms to sample only a subset of all the possible values (54 out of 1920 possibilities).
In each iteration, Optimizer Studio sets different values for the GOGC and GOMAXPROCS environment variables. These values propagate through the benchmark script and are read by the Go program, which uses them to configure the garbage collector and the number of Gorutines. The sampled results are uploaded in real time to the experiment management system for further analysis. The resulting time per operation versus the number of iterations performed by the benchmark is below:
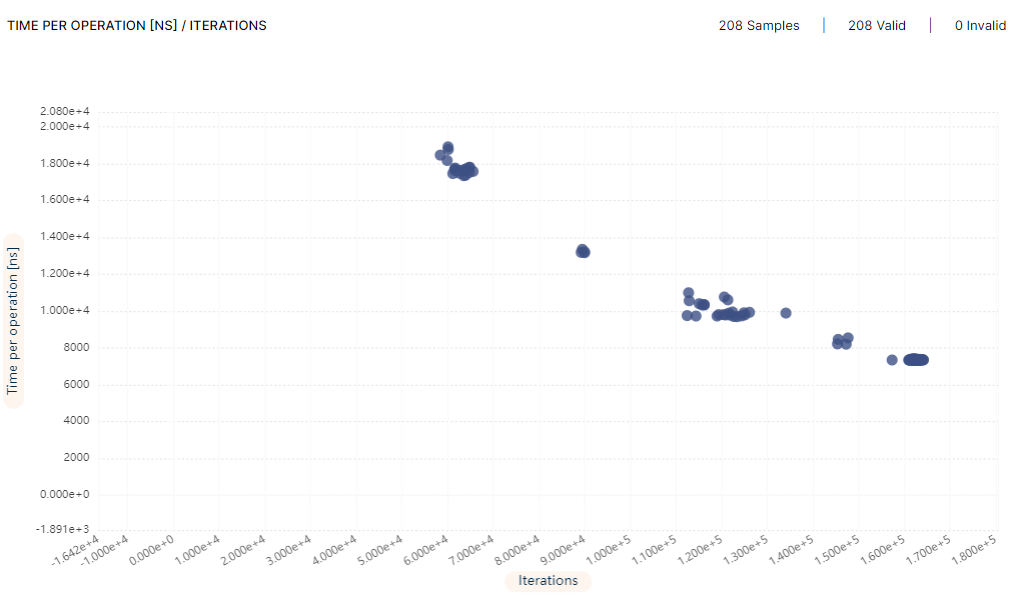
Time per operation [ns] Vs. number of iterations on AMD EPYC 7402P 24-Core Processor
The time per operation was reduced from 9.78μs to 7.34μs, a speedup of 1.33x, as detailed in the following table:
| GOGC | GOMAXPROCS | Time per operation | |
| Baseline | 100 | 48 | 9.78μs |
| Tuned | 25600 | 84 | 7.34μs |
The Go defaults are much worse on a dual socket server. We tested again but this time on a dual socket Intel Xeon 4214 server on Packet (s3.xlarge.x86), where there are 12 cores and 2 threads in each CPU chip:
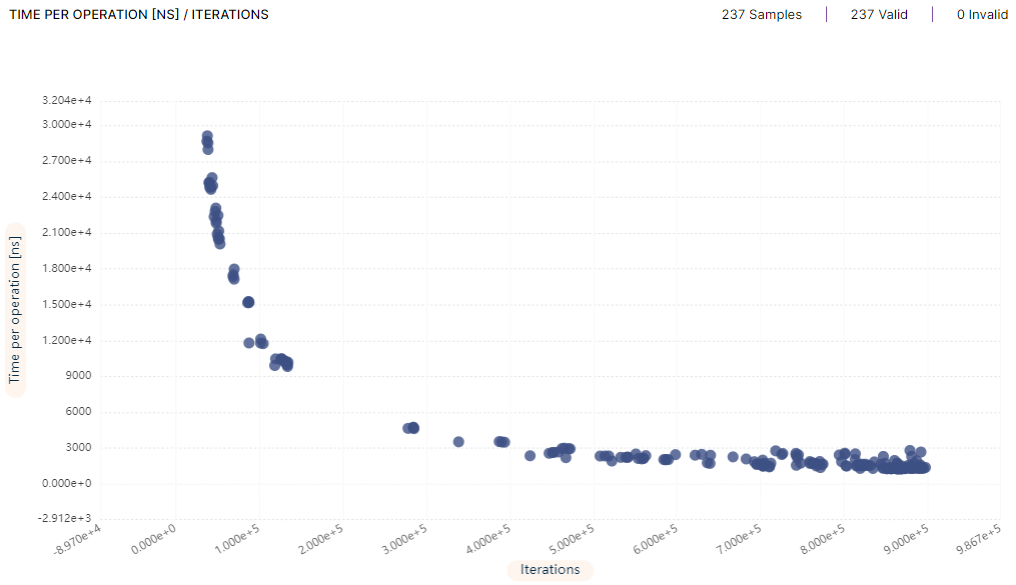
Time per operation [ns] Vs. number of iterations on Intel(R) Xeon(R) Silver 4214 CPU @ 2.20GHz
The time per operation was reduced from 10.12μs to 1.3μs, a speedup of 7.8x, as detailed in the following table:
| GOGC | GOMAXPROCS | Time per operation | |
| Baseline | 100 | 48 | 10.12μs |
| Tuned | 25600 | 92 | 1.30μs |
In our example, relying on the defaults Go provides resulted in poor performance. The default GOMAXPROCS and GOGC values were too low in both of the servers we tested on, aggressively triggering the garbage collector and not fully utilizing the parallel threads that can run on these servers. Using Optimizer Studio, the garbage collector and the number of Gorutines can be optimized for significant speedups, all automatically.